Blue Cube Technical Bulletin TB-101
Less Water, Saltier Water
What Your Watermaker Readings Are Really Telling You, and When to Act on Them
Prepared for: Chief engineers, marine engineers and offshore maintenance technicians running seawater RO watermakers from 2,000 to 40,000 gpd on offshore platforms and commercial vessels.
Executive Summary
The field problem. The watermaker is making less water than it used to, or the product TDS is creeping up. Someone wants to clean the membranes. Someone else wants to order new ones. Someone else wants to raise the pressure to get the water back. Any of those can be the right call, but they are usually made from raw gauge readings, and raw gauge readings are the least reliable information on the unit.
What is going on. A reverse osmosis membrane's output depends on the water it is fed as much as on its own condition. Feed temperature, feed pressure and feed salinity all move production and product quality, often by more than fouling does. A perfectly healthy membrane can lose a third of its output between summer and winter water. A badly fouled membrane can look normal in warm water.
Why it matters. Cleaning too late is the most expensive mistake in a seawater RO system. The major membrane manufacturers agree that fouling left too long may not clean out.1,2 A major membrane manufacturer also warns that the time between cleanings gets shorter each time it happens.1 Cleaning a temperature problem wastes chemicals and downtime. The only way to tell the difference is to correct the readings to standard conditions, a process called normalization, and compare them with the unit's own healthy baseline.
Section 3
Why Do Watermaker Gauge Readings Mislead You?
Raw gauge readings mislead because a watermaker's product flow is the result of two things: how clean the membranes are, and the conditions they are working in. The gauges only show the combined result. When product flow drops, the gauges cannot tell you which of the two changed.
Temperature is the biggest variable and the one most often overlooked. Warmer water passes through the membrane more easily, so the same unit at the same pressure makes more water in warm seas and less in cold ones. Watermaker product flow changes by roughly 3 percent per degree Celsius of feed water temperature.3 Warmer water also lets slightly more salt through, so product TDS rises in summer on a perfectly healthy unit.4
Worked example. A healthy unit that makes 26,400 gpd at 25 °C (77 °F), with everything else held the same:
| Feed water temperature | Product flow, same unit, same pressure |
|---|---|
| 15 °C (59 °F) | about 18,600 gpd |
| 25 °C (77 °F) | about 26,400 gpd |
| 30 °C (86 °F) | about 31,200 gpd |
A vessel moving from the Gulf of Mexico in August to the North Sea in February can lose 40 percent of its production with no change in membrane condition. The reverse is also true. A unit that fouled badly over a cold winter can look normal once the water warms up, and the fouling goes unnoticed until it is too late to clean out.
Feed pressure and salinity work the same way. More pressure pushes more water through. Saltier feed water pushes back harder and cuts output. A reading taken right after a pressure adjustment, or in brackish water near a river mouth, cannot be compared directly with last week's.
Section 4
What Is RO Normalization?
RO normalization is the industry method for converting each watermaker reading to what the unit would have produced at one fixed set of standard conditions. The method is defined in ASTM D4516, Standard Practice for Standardizing Reverse Osmosis Performance Data, and every major membrane manufacturer publishes a version of it.3
Normalization makes three corrections:
- Temperature. A temperature correction factor adjusts product flow and salt passage to a standard 25 °C (77 °F).
- Driving pressure. Output is proportional to net driving pressure: the pressure pushing water through the membrane, minus the product-side back pressure and the osmotic pressure of the seawater pushing back. Correcting for it removes the effect of pressure adjustments and changes in feed salinity.
- Salt passage. Salt passage is corrected for temperature and flow, so a warm-water rise in TDS is not mistaken for membrane damage.
Normalized numbers only mean something against a reference. The right reference is the unit's own healthy performance, recorded when the membranes are known to be clean: at commissioning, after a membrane change, or after a successful cleaning. That reading is the baseline. Every later reading is judged as a change from it.
Section 5
What Is Your Watermaker's Real Capacity?
A watermaker's real capacity is its working membrane area. It is sold as a production rate, but what the owner actually bought is membrane area. An 8-element unit with 400 ft² elements has 3,200 ft² of membrane. Every gallon it makes passes through that area.
The amount of water each square foot of membrane passes is called flux, usually expressed in gallons per square foot per day (gfd). A unit making 26,400 gpd through 3,200 ft² runs at a flux of about 8 gfd. Flux is the single most important number in how hard a unit drives its membranes. The higher the flux, the faster the membranes foul.
Fouling and scaling take membrane area out of service. There is no gauge that shows how many square feet are still working, and the loss is not neat or even. Biological fouling usually starts on the front elements, and scale usually starts on the last ones. But normalized production shows the combined effect. If normalized production is 90 percent of baseline, the membranes are doing the work with 90 percent of their original area.
| Normalized production vs baseline | Equivalent working area (8 × 400 ft²) | Membrane lost, in element equivalents | Extra flux on the remaining area to hold the same output |
|---|---|---|---|
| 100% | 3,200 ft² | 0 | 0% |
| 90% | 2,880 ft² | 0.8 element | 11% |
| 85% | 2,720 ft² | 1.2 elements | 18% |
| 80% | 2,560 ft² | 1.6 elements | 25% |
| 70% | 2,240 ft² | 2.4 elements | 43% |
| 50% | 1,600 ft² | 4 elements | 100% |
The last column explains why fouling speeds up once it starts. The crew still needs the same amount of water, so the operator raises the driving pressure to hold production. That is normal and necessary as membranes age. But it pushes more water through each square foot still working, which raises flux, which fouls that area faster. Without normalized readings, the higher pressure hides the decline: production looks steady right up until the pressure tops out.
Two more normalized numbers complete the picture:
- Normalized salt passage. The share of feed salt reaching the product. A marked rise points to scaling on the membrane surface, chemical damage, or a mechanical leak such as a failed O-ring or interconnector.
- Vessel pressure drop. Feed pressure minus concentrate pressure, corrected for flow. A rising number means the feed channels between the membrane leaves are clogging: biological fouling, silt, or debris getting past the prefilters.
Section 6
What Do Changes in Production, Salt Passage and Pressure Drop Mean?
Together, the changes in normalized production, salt passage and pressure drop point to the most likely cause: fouling, scaling, membrane damage, normal aging or a prefilter problem.
| What you see (normalized, versus baseline) | Most likely cause | What to do |
|---|---|---|
| Production down, pressure drop up, salt passage steady or only slightly changed | Fouling: biological, silt or organic, usually starting on the front elements | Clean: alkaline cleaner first, then acid. |
| Salt passage up markedly, production down, pressure drop up moderately | Scaling, usually on the last elements | Clean: alkaline cleaner first, then acid. |
| Salt passage up sharply, production up or steady | Membrane damage, most often chlorine attack, or an O-ring / interconnector leak | Probe the vessels or check TDS element by element. Cleaning will not fix it. |
| Production slowly down over months, everything else steady | Normal membrane aging | Expected. Keep cleaning on the numbers until cleaning stops paying off (see when to replace). |
| Prefilter pressure drop high | Loaded prefilters | Change the prefilters. |
| Prefilter pressure drop never rises, even in dirty water | Prefilter bypassing, or prefiltration not adequate for the feed water | Check filter seating and housings. Consider upgraded prefiltration (see common field problems). |
| Everything within about 10 percent of baseline | Healthy unit | Keep logging. |
| Readings outside the membrane's published limits | Operating outside limits | Stop or reduce load and correct the condition first. Normalized numbers cannot be trusted. |
Section 7
When Should Seawater RO Membranes Be Cleaned?
Clean seawater RO membranes when normalized production drops 10 percent, normalized salt passage rises 10 percent, or normalized pressure drop rises 15 percent from the baseline, whichever comes first. The major membrane manufacturers agree on nearly identical cleaning triggers, all based on normalized numbers compared with the baseline.1,2
| Source | Normalized production drop | Normalized salt passage rise | Normalized pressure drop rise |
|---|---|---|---|
| Membrane manufacturer A1 | 10% | 5 to 10% | 10 to 15% |
| Membrane manufacturer B2 | 10% | 10% | 15% |
| This bulletin uses | 10% | 10% | 15% |
H2O recommends cleaning when any one of the three triggers is reached. Do not wait for all three.
Plan a cleaning
Plan a membrane cleaning when normalized production is down 10 percent, salt passage is up 10 percent, or pressure drop is up 15 percent from baseline. This is normal. Every membrane fouls in service, and a slow slide to this point over weeks or months is exactly what should happen. Schedule the cleaning within the next few days of operation.
Clean now
Clean the membranes now when normalized production is down 20 percent, salt passage is up 20 percent, or pressure drop is up 30 percent from baseline. This level is considered heavy fouling.2 The layer is thick enough that cleaning chemical struggles to reach the bottom of it. Clean before the next extended run.
May not recover
When normalized production is down 30 to 50 percent from baseline, the membranes may be past the point of full recovery. Membrane manufacturers warn it may be impossible to restore performance from here.2 They also warn that late cleaning may not work and that the time between cleanings gets shorter afterward.1 Clean immediately and expect a lower recovery than usual.
Gradual or sudden? A slow decline over weeks is normal wear, and the only response needed is a cleaning at the trigger point. A sudden change between two readings, such as a jump in pressure drop or salt passage in a week, means something changed. Check the prefilters, the intake, dechlorination and any recent maintenance.
Hard limits. These come from the membrane data sheet, not from the trend. Exceeding them is a stop-and-fix condition, and no cleaning decision should be made from readings taken outside them. For a common seawater element, the data sheet limits are a maximum feed temperature of 45 °C (113 °F), a maximum feed pressure of 83 bar (1,200 psi), a maximum pressure drop of 1.0 bar (15 psi) per element, a maximum feed SDI of 5, and less than 0.1 ppm free chlorine.5 Check the data sheet for your own membranes.
| Limit | Value |
|---|---|
| Maximum feed temperature | 45 °C (113 °F) |
| Maximum feed pressure | 83 bar (1,200 psi) |
| Maximum pressure drop per element | 1.0 bar (15 psi) |
| Maximum feed SDI | 5 |
| Free chlorine | Less than 0.1 ppm |
Not sure if it is time to clean?
Enter this week's gauge readings in RO Rounds. It normalizes them, compares them with your baseline and tells you whether you have hit a cleaning trigger. Free, no login needed to start.
Check my readings in RO RoundsSection 8
When Should Seawater RO Membranes Be Replaced Instead of Cleaned?
Replace seawater RO membranes when a properly done cleaning can no longer bring normalized production back to 80 percent of the new-membrane baseline, or when cleanings are needed more than twice a month. Cleaning never brings a membrane all the way back. Each cleaning removes most of the fouling, but a small part is permanent: foulant bonded too tightly to remove, and slow aging of the membrane itself. So a healthy membrane's history is a sawtooth. Performance declines, a cleaning brings it most of the way back, it declines again, and the next cleaning brings it back a little less than the last.
That dashed line is the real membrane life. The membranes are finished when cleanings stop bringing performance back far enough, or come so close together that labor, chemicals and downtime cost more than a new set.
After every cleaning, compare normalized production with the new-membrane baseline, not with the reading taken just before the cleaning.
- If normalized production recovers to 90 percent or more of the new-membrane baseline, the cleaning worked. Carry on and clean again at the next trigger.
- If normalized production recovers to less than 90 percent of the new-membrane baseline, the unit restarts already at the cleaning trigger, so each cleaning buys less run time. The membranes are nearing the end of their useful life. Start planning a replacement set.
- If normalized production recovers to less than 80 percent of the new-membrane baseline, check the cleaning before blaming the membranes. A cleaning run at the wrong pH or temperature, with too short a soak, or skipping the alkaline or acid step can leave a good set of membranes looking finished. Have the cleaning procedure reviewed and repeat it correctly. If a properly done cleaning still cannot bring normalized production back to 80 percent, replace the membranes.
- If a watermaker needs cleaning more than twice a month to stay above the trigger, replace the membranes. At that frequency, labor, chemicals and downtime cost more than a new set.
In the end, the deciding question is simple: after cleaning, can the unit still make the water the vessel or platform needs? A unit that can only reach 80 percent of its new output is short of water unless it was sized with more than 20 percent spare capacity.
Salt passage that will not come down
Salt passage that will not come down after cleaning is a different problem. If normalized salt passage stays more than 10 percent above the new-membrane baseline after a proper cleaning, or product water stays off specification, the membrane surface is usually damaged. The most common cause is chlorine attack. Seawater RO membranes tolerate less than 0.1 ppm of free chlorine.5 Many vessels and platforms dose hypochlorite into the seawater system to control marine growth. If dechlorination upstream of the watermaker fails even briefly, the damage is permanent and no cleaning will repair it. H2O recommends replacing the membranes and finding and fixing the chlorine source before the new set goes in.
How long should membranes last?
In H2O's experience with seawater watermakers cleaned on normalized readings, a set of membranes typically lasts up to two to three years before cleaning can no longer recover it. Life depends on how much fouling the feed water carries, the flux the unit runs at, and how promptly the unit is cleaned.
After installing new membranes, record a new baseline.
Section 9
Why Does Watermaker Troubleshooting Go Wrong So Often?
Watermaker troubleshooting usually goes wrong because no baseline was ever recorded, logs hold only raw numbers, and units run hard from day one.
No baseline was ever recorded. Many watermakers are commissioned, handed over and left running without anyone logging a healthy reference reading. Without a baseline, every judgment about membrane condition is a guess.
Logs record raw numbers only. Many vessels and platforms keep a watermaker log, but it holds raw pressures, flows and TDS. Raw numbers move with water temperature and pressure as much as with membrane condition, so an uncorrected log cannot show fouling until it is severe.
Units run hard from day one. Land-based desalination plants can afford large membrane arrays and very conservative flux. Offshore platforms and vessels cannot: space and weight are at a premium, so watermakers are built compact and run at higher flux. That is a reasonable trade-off. But a unit that has to run at or near maximum production from the day it is commissioned is running well above the flux its membranes are designed for. It will foul faster, need cleaning sooner, and give less warning before the loss becomes permanent.
Common Field Problems
- Raising pressure without tracking why. Raising driving pressure as membranes age is normal and necessary to hold production. The problem is doing it without normalized readings. The rising pressure hides the decline, and the crew only finds out how far the membranes have gone when the pump runs out of pressure.
- Cleaning a temperature problem. Output dropped because the water got colder, not because the membranes fouled. The cleaning changes nothing, and the crew concludes the membranes are finished.
- Cleaning only by the calendar. A schedule is better than nothing, but fouling does not follow a schedule. Healthy membranes get cleaned for no reason, and fouled membranes wait until the next date.
- Prefiltration not matched to the feed water. In muddy, high-turbidity water, such as near river mouths, in shallow coastal areas or during storms, a cartridge filter alone is often not enough. It loads up too fast, or the crew stops changing it and it bypasses. A useful warning sign in the log: if the prefilter pressure drop never rises, the filter is probably bypassing. A bypassing prefilter lets suspended solids straight through to the high-pressure pump and the membranes, shortening the life of both.
- Starving the high-pressure pump. A clogged prefilter does not just cut flow to the high-pressure pump. It causes cavitation, which damages the pump. Prefilter pressure drop is a pump protection reading as much as a membrane one.
- Replacing membranes without finding the cause. If the old set failed from chlorine attack or repeated heavy fouling, the new set will fail the same way.
Section 10
What Does It Cost When Membrane Fouling Is Missed?
A missed fouling warning costs membranes that no longer clean out, pump repairs, water shortages, off-spec water and a higher maintenance budget.
 Sediment fouling on an unrolled membrane leaf. Photo: Piotr Pisarski, CC BY-SA 4.0, via Wikimedia Commons.
At the membrane.
Fouling left past the heavy-fouling point may never clean out. Membrane manufacturers warn that once performance drops 30 to 50 percent, full recovery may be impossible.2 Every cleaning afterward recovers less, and the membranes reach the end of their life early.
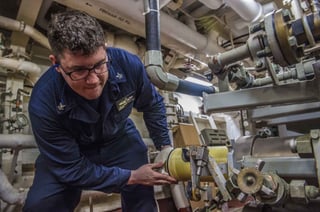 Engineman repairing a shipboard reverse osmosis unit, USS Mustin. U.S. Navy photo, public domain.
At the pump.
Cavitation from a starved suction, and solids from a bypassing prefilter, wear the high-pressure pump's valves, seals and other wear parts. Pump repairs offshore mean parts, labor and downtime.
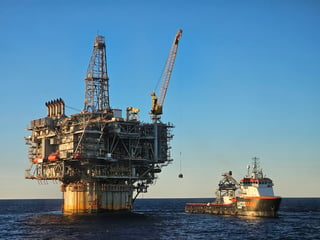 Supply vessel alongside an offshore production platform. Photo: GuavaTrain, CC0, via Wikimedia Commons.
At the vessel or platform.
A watermaker that can no longer meet demand means water rationing, water deliveries by supply boat, or bunkering at port. Offshore, every delivery competes for deck space and boat time.
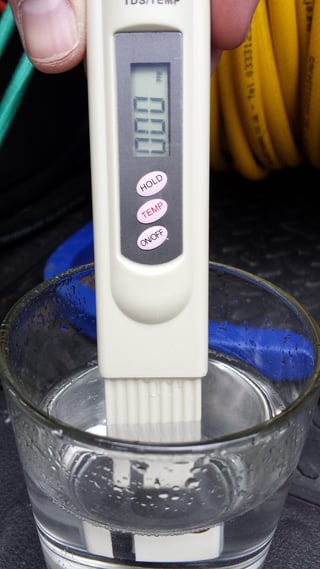 Handheld TDS meter testing product water. Photo: Spotless property, CC BY-SA 3.0, via Wikimedia Commons.
At the water quality level.
Rising salt passage pushes product TDS toward and past potable limits. Scale damage and chlorine attack cannot be reversed, and off-spec water must be dumped until the membranes are replaced.
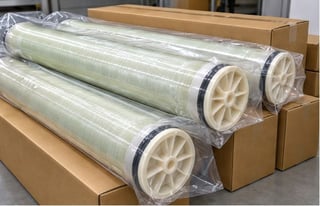 New seawater RO membrane elements in shipping packaging.
At the maintenance budget.
A set of seawater membranes replaced at one year instead of two doubles the membrane cost per year of operation, before counting the extra cleanings, chemicals, labor and downtime.
Section 11
The Remedy: Normalize Every Reading with RO Rounds
Everything in this bulletin comes down to one habit: take the same readings every week, normalize them, and compare them with a healthy baseline. Done by hand, normalization means temperature correction factors, osmotic pressure and net driving pressure calculations for every reading. In practice it rarely gets done.
H2O built RO Rounds for Watermakers to do it for you. Enter the readings from your gauges, and RO Rounds normalizes them, compares them with your baseline, and tells you in plain language what the numbers mean and what to do next. It is free, works with any seawater RO watermaker from 2,000 to 40,000 gpd, and needs no account to use. A free account saves your readings and shows your trends.
| Step | Action | What it involves |
|---|---|---|
| 1 | Set up your unit | Capacity, number and size of elements, and membrane model. |
| 2 | Log a healthy baseline | One reading when the membranes are known to be clean: at commissioning, after a membrane change, or after a successful cleaning. |
| 3 | Log weekly readings | Feed temperature, feed and concentrate pressure, product and concentrate flow, product TDS, and prefilter inlet and outlet pressure. |
| 4 | Get a plain-language verdict | Normalized numbers compared with your baseline, the likely cause, and exactly what to do next. |
| 5 | Record what you did | Log cleanings, prefilter changes and membrane replacements so the trend stays accurate. |
| 6 | Watch the trend | See how much each cleaning recovers and know when replacement is due. |
| 7 | Request support | Send your readings to an H2O engineer for review, straight from the tool. |
Section 12
Frequently Asked Questions
Why is my watermaker making less water than it used to?
Often it is because the feed water got colder, not because the membranes fouled. Watermaker product flow changes by roughly 3 percent per degree Celsius of feed water temperature, so compare normalized readings with the unit's healthy baseline before cleaning or replacing membranes.
What is RO normalization?
RO normalization converts each watermaker reading to what the unit would have produced at one fixed set of standard conditions. It corrects for temperature, net driving pressure and salt passage, and the method is defined in ASTM D4516.
When should seawater RO membranes be cleaned?
Clean seawater RO membranes when normalized production drops 10 percent, normalized salt passage rises 10 percent, or normalized pressure drop rises 15 percent from the baseline, whichever comes first. Do not wait for all three.
Why is my watermaker's product TDS going up?
Warmer feed water lets slightly more salt through, so product TDS rises in summer on a perfectly healthy unit. A marked rise in normalized salt passage points to scaling on the membrane surface, chemical damage such as chlorine attack, or a mechanical leak such as a failed O-ring or interconnector.
How long do seawater RO membranes last?
In H2O's experience with seawater watermakers cleaned on normalized readings, a set of membranes typically lasts up to two to three years. Life depends on how much fouling the feed water carries, the flux the unit runs at, and how promptly the unit is cleaned.
When should seawater RO membranes be replaced?
Replace seawater RO membranes when a properly done cleaning can no longer bring normalized production back to 80 percent of the new-membrane baseline, or when cleanings are needed more than twice a month. Membranes damaged by chlorine attack cannot be repaired by cleaning and must be replaced.
What readings should a platform crew log for the RO unit?
Once a week: feed temperature, feed and concentrate pressure, product and concentrate flow, product TDS, and prefilter inlet and outlet pressure. Also log one healthy baseline after commissioning, a membrane change or a successful cleaning.
Why does my offshore RO unit make less water in winter?
Colder seawater passes through the membrane more slowly, so output drops roughly 3 percent per degree Celsius. A unit moving from the Gulf of Mexico in August to the North Sea in February can lose 40 percent of its production with no fouling at all.
Section 13
Get Started
RO Rounds for Watermakers
Before you clean, before you replace, check the normalized numbers. Free. No login needed to start. Request an H2O engineer's review directly from the tool.
Watermaker Performance: The Blue Cube Technical Bulletin Series
TB-101 is part of H2O's seawater RO watermaker guide. Each bulletin goes deeper on one part of keeping a watermaker healthy.
- TB-101 Less Water, Saltier Water: What Your Watermaker Readings Are Really Telling You (you are here)
- TB-102 How to Clean Seawater RO Membranes (coming soon)
- TB-103 How to Lay Up a Seawater RO System and Bring It Back Online Without Damaging the Membranes (coming soon)
- TB-104 Prefiltration (coming soon)
- TB-105 Potable Water Post-Treatment (coming soon)
- TB-106 Start-Up and Commissioning of Seawater RO Membranes (Wet Versus Dry-Type) (coming soon)
- TB-107 Sizing a Seawater RO System (coming soon)
Download the Free PDF
Fill in the form to download TB-101 as a PDF. We will also send you each new bulletin in the series when it is published, starting with TB-102, How to Clean Seawater RO Membranes.
About H2O, Inc.
H2O designs and manufactures industrial water treatment systems for offshore oil and gas and commercial marine applications. Founded in 1980 in Lafayette, Louisiana, H2O supplies seawater reverse osmosis watermakers under the Blue Cube brand, along with replacement membranes, membrane cleaners and prefiltration equipment for seawater RO systems of any make.
H2O provides global on-site service and no-cost troubleshooting for any brand of seawater RO system.
841 Vincent Road, Lafayette, LA 70508 · T 337.857.7203 · h2oinc.com
References
- DuPont FilmTec, Cleaning Procedures for FilmTec Elements, Form 45-D01696-en, Rev 13, February 2026.
- Nitto Hydranautics, Technical Service Bulletin TSB107.29, April 2026.
- ASTM D4516-19a, Standard Practice for Standardizing Reverse Osmosis Performance Data.
- DuPont FilmTec, Factors Affecting RO Membrane Performance, Form 45-D01921-en, Rev 2, June 2025.
- DuPont FilmTec, SW30HRLE-400 Product Data Sheet, Form 45-D00967-en, Rev 8, January 2026.
Technical Bulletin TB-101 · Revision 1 · November 2, 2026 · Written by Jess Fike · © H2O Inc.