PEPCON Electrochlorination Technical Bulletin TB-DS001
Seawater Cooling for Floating Data Centers
Part 1: The heat to reject, what fouling costs, and how to keep the system clean
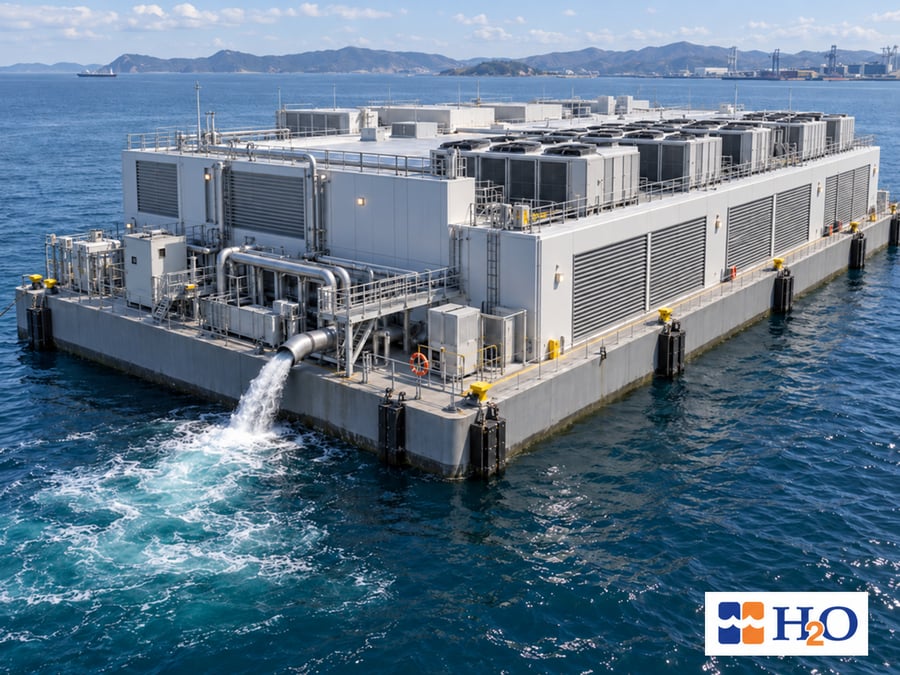
Prepared for: Naval architects, marine and cooling-system engineers, and package engineers developing floating data centers.
Executive Summary
Floating data centers are moving from concept to engineering. Shipbuilders and developers have publicly described designs from 30 MW to 200 MW, most of them using liquid cooling on the IT side and seawater as the final heat sink. That removes evaporative water use, but it creates a large marine cooling-water system, and that system must be engineered.
TB-DS001, the first of four bulletins in this series, frames the problem. It shows how much seawater a heat load needs, what marine growth does to heat transfer, why strainers cannot stop it, and the treatment principle that keeps a system clean: hold a chlorine residual at the outfall.
What the numbers say
- Every megawatt of heat rejected to seawater at a 5 °C rise needs about 176 m³/h. That is about 8,800 m³/h (2.4 m³/s) for 50 MW and 35,200 m³/h for 200 MW. The project heat balance, not the headline megawatts, sets the number.
- In a modeled plate heat exchanger sized for a 3 °C approach, a fouling film equal to the TEMA seawater fouling allowance cuts heat rejection by about 14 percent at fixed temperatures.
- Strainers remove debris but pass smaller organisms; larval capture depends on aperture and life stage. Filtration alone does not stop marine growth.
- A small positive chlorine residual at the outfall, as low as possible while still positive, keeps the system clean from the start. Discharge limits on that residual run from about 0.2 to 0.5 mg/L measured at the outfall. Some regulators instead set a limit as low as 0.01 mg/L (10 µg/L) at the edge of the mixing zone.
Section 1
How does a floating data center reject its heat to the sea?
Through a thermal chain that ends in once-through seawater (Figure 1). The IT side is a closed system: treated water or coolant, chemically controlled, with no marine growth. The seawater circuit is open to the ocean. It carries debris, organisms, chlorides and dissolved oxygen through the sea chest, strainers, pumps, piping and heat exchangers, then returns to the sea. Anything that degrades the seawater heat exchanger moves the whole chain.
Section 2
How much seawater does a floating data center need?
The seawater flow needed to carry a heat load follows from an energy balance, Q = m × Cp × ΔT. For seawater at 35 g/kg near 25 °C, density is about 1,025 kg/m³ and specific heat about 3.99 kJ/kg·K.2 In practical units, every megawatt rejected at a 5 °C rise needs about 176 m³/h.
The headline megawatts do not add these up. A published figure may be IT capacity, facility load or generating capacity. It cannot say how much generated power reaches the compute, or how much heat the power plant sends to the sea instead of up the stack. The seawater duty comes from the project heat balance, and cooling has to be treated as a first-order design driver from the start. Table 1 gives the flow for any heat load.
| Heat rejected to seawater | ΔT 3 °C (m³/h) | ΔT 5 °C (m³/h) | ΔT 7 °C (m³/h) |
|---|---|---|---|
| 30 MW | 8,800 | 5,300 | 3,800 |
| 50 MW | 14,700 | 8,800 | 6,300 |
| 60 MW | 17,600 | 10,600 | 7,500 |
| 100 MW | 29,300 | 17,600 | 12,600 |
| 200 MW | 58,700 | 35,200 | 25,100 |
The seawater temperature rise is a design choice, and everything else moves with it. A higher rise cuts flow, pump power, piping and treatment capacity, but it needs more heat-exchanger area for the same approach, raises the discharge temperature, and leaves less margin for fouling.
Section 3
Why does marine growth cost compute capacity?
Marine growth comes in two forms. Microfouling is bacteria and algae that form a biofilm within hours. It is mostly water and conducts heat poorly, so it adds thermal resistance directly in the heat path. Macrofouling is the settlement and growth of mussels, barnacles and similar organisms. It narrows pipes and exchanger channels and raises pressure drop until flow falls.
In a power plant, a fouled condenser costs efficiency. In a data center, a fouled heat exchanger costs capacity. The chain is short:
- Fouling raises the thermal resistance of the seawater heat exchanger.
- The approach temperature rises, and with it the facility loop supply temperature.
- The temperature delivered to the IT equipment rises.
- The operator can run more seawater, with steeply rising pump energy, accept a hotter IT supply, or reduce the IT load.
What does the evidence show?
In an experiment on a small titanium plate heat exchanger cooled with seawater, the overall heat-transfer coefficient fell by about 21 to 22 percent over the test, and the fouling resistance 30 days in was about 6.1 × 10⁻⁵ m²·K/W in winter and 7.0 × 10⁻⁵ in early summer.3
The standard TEMA fouling allowance for seawater is 9 × 10⁻⁵ m²·K/W at 52 °C or below.4 It is a shell-and-tube convention, and plate exchangers are often designed with less, but it is the same order as the 30-day measurement.
Figure 3 shows the scale of the effect for an illustrative plate heat exchanger: counterflow, balanced capacity rates, a 5 °C change on each side, a clean overall coefficient of 5,000 W/m²·K, and one fouling resistance on the seawater side. It shows the shape of the problem, not a particular design.
At the design allowance, exchangers sized for clean approaches of 2, 3 and 5 °C retain 88.6, 85.6 and 81.6 percent of their heat rejection, or at fixed load see the approach rise by 0.9, 1.4 and 2.3 °C. For an exchanger with a clean heat-rejection duty of 50 MW and a 3 °C clean approach, this model predicts about 7 MW less heat-rejection capacity at fixed inlet temperatures and flows. Whether that requires reducing IT load depends on the available cooling margin and allowable operating temperatures. An untreated system can exceed the design allowance, and macrofouling adds a hydraulic penalty on top.
Section 4
Why can't strainers alone prevent marine growth?
A seawater circuit has two jobs, shown in Figure 4. The first is physical: keep debris out of the pumps and heat exchangers. The second is biological: keep marine growth from establishing anywhere in the wetted path. Strainers do the first. They cannot do the second, because the openings that work at these flows are millimeter scale and the organisms that cause fouling are far smaller.
For orientation, bacteria are about 0.5 to 5 µm, small plankton and algae about 20 µm to 1 mm, and mussel and barnacle larvae about 0.1 to 0.5 mm. Only seaweed, shells and debris at millimeter scale are stopped by the strainers.
Section 5
How do you prevent marine growth in a seawater cooling system?
Hold a small, positive chlorine residual at the outfall, all the time, from the first day.
Chlorine reacts with everything in the seawater that can be oxidized, including the organisms and slime that would otherwise foul the system. A measurable outfall residual shows oxidant remained through the flowing circuit: a useful indicator, but exposure throughout the system must still be verified. If the outfall reads zero, all of the chlorine was consumed, and there is no way to know whether more work was left to do.
A residual of 0.1 to 0.5 mg/L is a typical target, and published power-station practice holds about 0.2 mg/L at the exchanger outlets with continuous low-level dosing.5 The residual is measured as total residual oxidant (TRO) expressed as chlorine. In seawater, part of the oxidant is present as bromine compounds, which also help control fouling, and regulators of saline discharges commonly write limits as TRO for that reason.
The target is the lowest residual that is still positive. Hypochlorite beyond that is wasted: there is no value in discharging 1 mg/L when 0.1 mg/L would have shown there was more than enough. A lower residual also keeps the discharge inside the limits in Section 6.
The aim is to keep the system clean from the beginning so that foulant cannot get a foothold, not to shock dose a system that has already fouled. Dosing continuously at the intake, so that the whole wetted path including the sea chest is treated, with the residual measured at the outfall and fed back to the dosing control, keeps microfouling and macrofouling from establishing. Shock dosing remains a recovery tool. Lines that carry no flow, such as standby piping and dead legs, are the exception and need flushing or their own treatment.
Where does the hypochlorite come from offshore?
Sodium hypochlorite is the usual chemical. On a floating facility it is typically generated on site from seawater by electrochlorination, which TB-DS002 covers, including sizing from the flows in Table 1.
Section 6
What chlorine discharge limits apply to seawater cooling water?
Limits are set by the permitting authority for each site, and they take two forms. An outfall limit caps the residual in the discharged water, usually a few tenths of a mg/L. An ambient standard caps the concentration at the edge of a defined mixing zone, in µg/L, so dilution does part of the work. Chlorine oxidants also decay quickly in seawater, so the residual at the outfall is typically well below the dose.7 Table 2 shows representative limits.
| Jurisdiction | Limit | Where it applies |
|---|---|---|
| United States, federal steam-electric rule (40 CFR 423.13) | 0.2 mg/L total residual chlorine, maximum | Coastal steam-electric power stations only; the site's NPDES permit may set a different limit. Seawater permits are often written as TRO because of bromide |
| United States, marine water quality criteria | 13 µg/L acute; 7.5 µg/L chronic chlorine | Edge of the mixing zone, through dilution |
| IFC / World Bank Group, thermal power guideline | 0.2 mg/L total residual chlorine | Once-through cooling water discharge |
| United Kingdom and European Union practice | 10 µg/L (95th percentile) chlorine as TRO | Marine waters, at the edge of the mixing zone |
| India, Central Pollution Control Board, thermal power | 0.5 mg/L free available chlorine | Once-through condenser cooling water. A coastal nuclear station measured 0.06 to 0.42 mg/L total residual chlorine at the outfall |
| Tropical marine norms described in the literature | About 0.2 mg/L TRO | Outfall, continuous |
Two points follow. Most of these limits sit at 0.5 mg/L or below at the outfall, and the strictest are written as ambient standards in µg/L at the edge of the mixing zone, so a low residual is both cheaper and easier to permit. The project permit sets the real number, including the sampling point and whether it is written as total residual chlorine or total residual oxidant, so the permitting route should be settled early.
Section 7
What should floating data center designers do first?
Seawater cooling should be engineered as an integrated cooling-water management system, not treated as a simple pumping problem. The practical first steps:
- Build the heat balance across the IT stack, power conversion and the power source.
- Choose the temperature rise with fouling margin in view.
- Separate debris control from marine growth control.
- Treat to a small positive residual from the first day, inside the permit.
Frequently Asked Questions
What happens if a floating or offshore data center runs its seawater cooling without electrochlorination?
Without continuous marine growth control, biofilm forms in the seawater heat exchanger within hours and larvae that pass the strainers settle and grow downstream. Heat-rejection capacity falls, pressure drop and pump energy rise, and the operator must run more seawater, accept a hotter IT supply, or reduce the IT load. In a modeled 50 MW exchanger with a 3 °C clean approach, fouling at the TEMA seawater allowance costs about 7 MW of heat-rejection capacity.
What is the best way to control biofouling in an offshore data center cooling system?
Prevent it rather than clean it: dose continuously at the intake to hold a small, positive chlorine residual through the whole wetted path, measured at the outfall. On a floating facility the sodium hypochlorite is typically generated on site from seawater by electrochlorination.
How much seawater does a floating data center need for cooling?
About 176 m³/h for every megawatt of heat rejected to seawater at a 5 °C temperature rise. That is about 8,800 m³/h (2.4 m³/s) for 50 MW and 35,200 m³/h for 200 MW. The project heat balance, not the headline megawatts, sets the real number.
Why is marine growth a problem for floating data centers?
Marine growth fouls the seawater heat exchanger, which raises approach temperature, pressure drop and pump energy. In a data center a degraded heat exchanger is lost compute: in a modeled 50 MW plate heat exchanger with a 3 °C clean approach, fouling at the TEMA seawater allowance cuts heat-rejection capacity by about 7 MW.
Can strainers or filters prevent marine growth in a seawater cooling system?
No. Strainers keep debris out of the pumps and heat exchangers, but their openings are millimeter scale. Bacteria, algae and mussel and barnacle larvae are far smaller, pass through, settle downstream and grow where flow is lowest. Filtration alone does not stop marine growth.
How do you prevent marine growth in a seawater cooling system?
Hold a small, positive chlorine residual at the outfall, all the time, from the first day. Dose continuously at the intake so the whole wetted path, including the sea chest, is treated, and measure the residual at the outfall to feed back to the dosing control.
What chlorine residual should a seawater cooling system hold?
The lowest residual that is still positive at the outfall. A residual of 0.1 to 0.5 mg/L is a typical target, measured as total residual oxidant (TRO) expressed as chlorine. A lower residual wastes less hypochlorite and is easier to keep inside discharge limits.
How is hypochlorite supplied on a floating facility?
Sodium hypochlorite is typically generated on site from seawater by electrochlorination. For lightly crewed facilities, PEPCON's FlexiFit electrochlorination system holds the residual automatically, with Cell Guardian monitoring every cell and the CleanWave option running the cell cleaning cycle automatically.
What are typical chlorine discharge limits for seawater cooling water?
Outfall limits usually run from about 0.2 to 0.5 mg/L. Some regulators instead set ambient standards as low as 10 µg/L at the edge of the mixing zone. The project permit sets the real number, including the sampling point and whether it is written as total residual chlorine or total residual oxidant.
Get Started
Request a first-pass sizing
Send the heat balance, seawater temperature range, and intake and discharge arrangement, and H2O will return the seawater flow, the electrochlorination treatment capacity, and a dosing philosophy.
Seawater Cooling for Floating Data Centers: The Series
TB-DS001 is the first of four PEPCON electrochlorination bulletins on seawater cooling for floating data centers.
- TB-DS001 Part 1: The heat to reject, what fouling costs, and how to keep the system clean (you are here)
- TB-DS002 Marine growth control and dosing: electrochlorination design and sizing, dosing strategy, and hydrogen handling (coming soon)
- TB-DS003 Reliability and controls: redundancy, monitoring, automated cleaning, and normalization (coming soon)
- TB-DS004 Materials and thermal discharge: corrosion, intake effects, and thermal discharge (coming soon)
About H2O and PEPCON Systems
H2O designs seawater treatment and marine-growth-prevention systems for mission-critical offshore applications, and PEPCON Systems, its electrochlorination division, has built systems since 1968. For a first-pass sizing, send the heat balance, seawater temperature range, and intake and discharge arrangement, and we will return the flow, treatment capacity and a dosing philosophy.
841 Vincent Road, Lafayette, LA 70508 · T 337.857.7203 · h2oinc.com
References
- Floating data center developments: Offshore magazine (ABS and Samsung Heavy Industries); The Register, 6 July 2026; Smart Maritime Network, 4 August 2026, and Datacenter Intelligence (Mousterian); The Digital Ship and Data Center Frontier (Seatrium); Marine Log and gasworld (Hanwha Ocean); Data Center Dynamics and Baxtel (Keppel); Data Center Knowledge (MOL and Hitachi); Cyprus Shipping News, 12 August 2026 (HD KSOE); Capacity Media, Backblaze, and nautilusdt.com (Nautilus). All retrieved October 2026.
- Sharqawy, M.H., Lienhard, J.H., Zubair, S.M. (2010). Thermophysical properties of seawater. Desalination and Water Treatment 16, 354 to 380.
- Ichinose, J., Takami, T., Nishida, T. (2019). Experimental study of marine biofouling for the plate type heat exchanger with sea water cooling. Journal of National Fisheries University 67(2), 71 to 77.
- Tubular Exchanger Manufacturers Association (TEMA) Standards, fouling resistances for water (sea water, 52 °C or less), as reproduced in Heat Transfer in Process Engineering, Appendix F, accessengineeringlibrary.com; Engineering ToolBox, heat exchangers: fouling and reduced heat transfer, engineeringtoolbox.com.
- Chlorination chemistry and ecotoxicology of the marine cooling water systems (citing Khalanski and Jenner, 2012), researchgate.net/publication/225251970.
- Murthy, P.S. (2022). Antifouling Strategies and Environmental Issues in Industrial Cooling Water Systems in Marine Environment. In: Chakraborty, P., Snow, D. (eds), Legacy and Emerging Contaminants in Water and Wastewater. Springer, Cham, pp. 93–120. doi.org/10.1007/978-3-030-95443-7_5.
- Australian Water Association, New guidance values for chlorine in marine waters, Water e-Journal 8(1), 2022.
- U.S. 40 CFR 423.13, ecfr.gov. U.S. EPA Region 1, Mirant Canal permit response to comments, epa.gov.
- IFC, EHS Guidelines for Thermal Power Plants (2008), ifc.org.
- Estuarine, Coastal and Shelf Science, challenges in the management and regulation of large cooling water discharges, sciencedirect.com/science/article/abs/pii/S0272771416304589.
- India, Central Pollution Control Board, thermal power plant effluent norms, cpcb.nic.in. Monitoring chlorine residual and trihalomethanes in the chlorinated seawater effluent of a nuclear power plant, Environmental Monitoring and Assessment (2019), link.springer.com/article/10.1007/s10661-019-7611-0.
Calculations are H2O estimates from the stated assumptions, not a design basis. Limits are examples to confirm per project.
Technical Bulletin TB-DS001 · Part 1 of 4 · Revision 1 · November 19, 2026 · Written by Jess Fike · © H2O Inc.